matplotlibでのテキストの表示
グラフエリアへのテキストの表示(=Axesインスタンスへのテキストの追加)のコード例を見てみましょう。まずは、「Hello, World!」を表示します。
pyplot スタイル
pyplotのtext関数を用います。
import matplotlib.pyplot as plt
plt.plot()
plt.axis('off')
plt.text(0, 0, 'Hello, World!')
plt.show()
オブジェクト指向スタイル
Axesクラスのtextメソッドを用います。
import matplotlib.pyplot as plt
fig, ax = plt.subplots()
ax.set_axis_off()
ax.text(0, 0, 'Hello, World!')
plt.show()
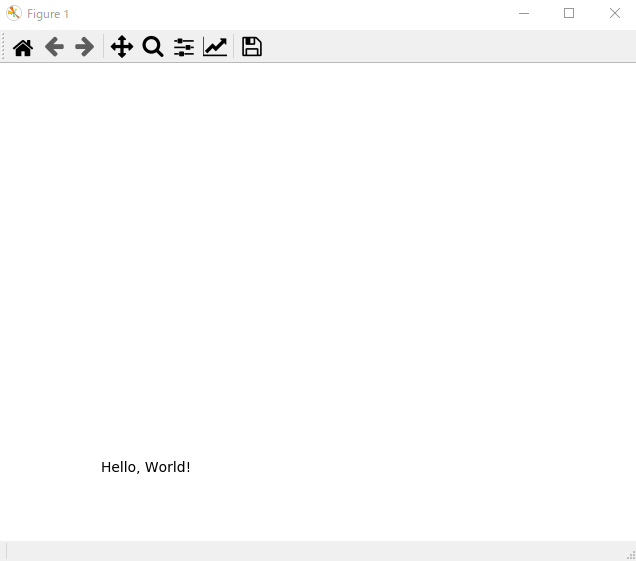
引数に座標と表示するテキストを指定することで、上図のように表示させることができました。なお、matplotlibの座標系は左下が原点なので、座標(0, 0)で指定すると上図のように左下に描画されます。
内部では、「Textインスタンスを生成して、それをAxesインスタンスへ追加する」という処理をしています。次のように、ここで追加したTextインスタンスを変数として保持すれば、あとからテキストの書式を変更することも可能になります。
txt = ax.text(0, 0, 'Hello, World!')
なお、pyplotのtext関数と、Axesクラスのtextメソッドでは使い方は同じなので、以降ではオブジェクト指向スタイルで解説を行います。
テキストの書式設定
Textクラスのプロパティによって書式を設定します。このTextクラスのプロパティはAxesクラスのtextメソッドの引数**kwargsの部分に指定することで、プロパティの値を指定してTextインスタンスを生成することができます。
それでは以下で、Textのプロパティでテキストの書式がどのように変化するのかを見ていきましょう。
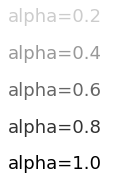
alpha : 透過度の設定
import matplotlib.pyplot as plt
fig, ax = plt.subplots()
ax.set_axis_off()
ax.text(0, 0.4, 'alpha=0.2', alpha=0.2)
ax.text(0, 0.3, 'alpha=0.4', alpha=0.4)
ax.text(0, 0.2, 'alpha=0.6', alpha=0.6)
ax.text(0, 0.1, 'alpha=0.8', alpha=0.8)
ax.text(0, 0, 'alpha=1.0', alpha=1.0)
plt.show()
alphaプロパティでテキストの透過度を設定します。0が透明、1.0が不透明で、0~1.0の範囲で指定します。
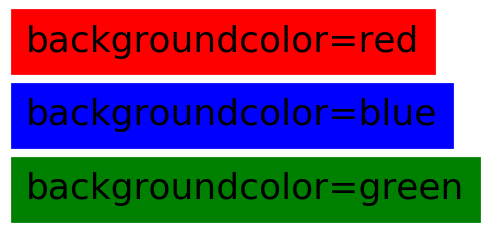
backgroundcolor : 背景色の設定
import matplotlib.pyplot as plt
fig, ax = plt.subplots()
ax.set_axis_off()
ax.text(0, 0.2, 'backgroundcolor=red', backgroundcolor='red')
ax.text(0, 0.1, 'backgroundcolor=blue', backgroundcolor='blue')
ax.text(0, 0, 'backgroundcolor=green', backgroundcolor='green')
plt.show()
backgroundcolorプロパティで文字の背景色を指定します。色の指定方法はこちらをご覧ください。
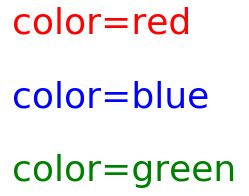
color : 文字色の設定
import matplotlib.pyplot as plt
fig, ax = plt.subplots()
ax.set_axis_off()
ax.text(0, 0.2, 'color=red', color='red')
ax.text(0, 0.1, 'color=blue', color='blue')
ax.text(0, 0, 'color=green', color='green')
plt.show()
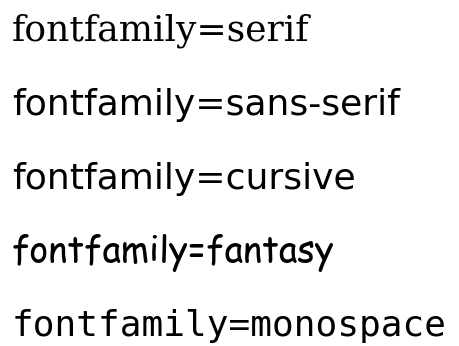
fontfamily : フォントの設定
import matplotlib.pyplot as plt
fig, ax = plt.subplots()
ax.set_axis_off()
ax.text(0, 0.4, 'fontfamily=serif', fontfamily='serif')
ax.text(0, 0.3, 'fontfamily=sans-serif', fontfamily='sans-serif')
ax.text(0, 0.2, 'fontfamily=cursive', fontfamily='cursive')
ax.text(0, 0.1, 'fontfamily=fantasy', fontfamily='fantasy')
ax.text(0, 0, 'fontfamily=monospace', fontfamily='monospace')
plt.show()
fontfamilyプロパティで文字のフォントを指定します。
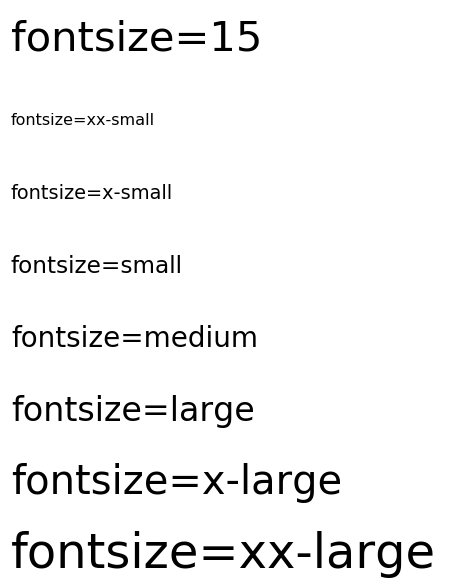
fontsize : 文字サイズの設定
import matplotlib.pyplot as plt
fig, ax = plt.subplots()
ax.set_axis_off()
ax.text(0, 0.7, 'fontsize=15', fontsize=15)
ax.text(0, 0.6, 'fontsize=xx-small', fontsize='xx-small')
ax.text(0, 0.5, 'fontsize=x-small', fontsize='x-small')
ax.text(0, 0.4, 'fontsize=small', fontsize='small')
ax.text(0, 0.3, 'fontsize=medium', fontsize='medium')
ax.text(0, 0.2, 'fontsize=large', fontsize='large')
ax.text(0, 0.1, 'fontsize=x-large', fontsize='x-large')
ax.text(0, 0, 'fontsize=xx-large', fontsize='xx-large')
plt.show()
fontsizeプロパティで文字サイズを指定します。
文字サイズの指定は数値で文字のポイント単位で指定するか、{‘xx-small’, ‘x-small’, ‘small’, ‘medium’, ‘large’, ‘x-large’, ‘xx-large’}のいずれかで相対サイズを指定します。
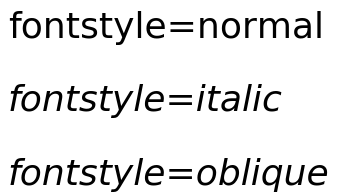
fontstyle : フォントスタイルの設定
import matplotlib.pyplot as plt
fig, ax = plt.subplots()
ax.set_axis_off()
ax.text(0, 0.2, 'fontstyle=normal', fontstyle='normal')
ax.text(0, 0.1, 'fontstyle=italic', fontstyle='italic')
ax.text(0, 0, 'fontstyle=oblique', fontstyle='oblique')
plt.show()
fontstyleプロパティでフォントスタイルを設定します。
スタイルを{‘normal’ (=通常), ‘italic’ (=イタリック体), ‘oblique’ (=斜体)}のいずれかで指定します。なお、フォントが対応していないと設定は反映されません。
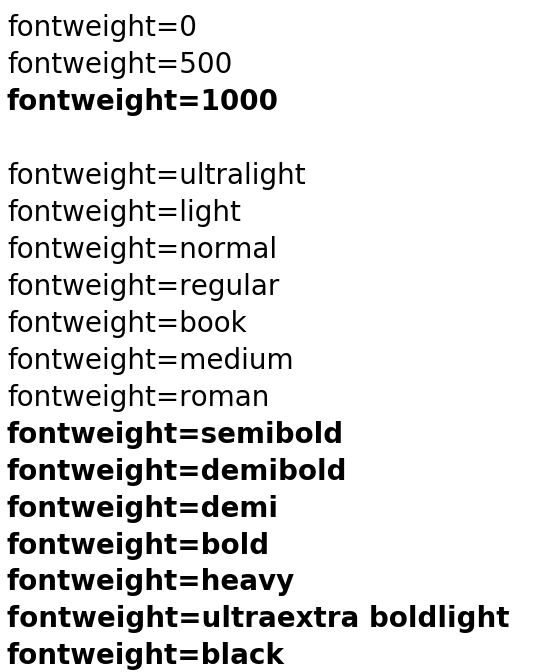
fontweight : 文字の太さの設定
import matplotlib.pyplot as plt
fig, ax = plt.subplots()
ax.set_axis_off()
ax.text(0, 0.85, 'fontweight=0', fontweight=0)
ax.text(0, 0.8, 'fontweight=500', fontweight=500)
ax.text(0, 0.75, 'fontweight=1000', fontweight=1000)
ax.text(0, 0.65, 'fontweight=ultralight', fontweight='ultralight')
ax.text(0, 0.6, 'fontweight=light', fontweight='light')
ax.text(0, 0.55, 'fontweight=normal', fontweight='normal')
ax.text(0, 0.5, 'fontweight=regular', fontweight='regular')
ax.text(0, 0.45, 'fontweight=book', fontweight='book')
ax.text(0, 0.4, 'fontweight=medium', fontweight='medium')
ax.text(0, 0.35, 'fontweight=roman', fontweight='roman')
ax.text(0, 0.3, 'fontweight=semibold', fontweight='semibold')
ax.text(0, 0.25, 'fontweight=demibold', fontweight='demibold')
ax.text(0, 0.2, 'fontweight=demi', fontweight='demi')
ax.text(0, 0.15, 'fontweight=bold', fontweight='bold')
ax.text(0, 0.1, 'fontweight=heavy', fontweight='heavy')
ax.text(0, 0.05, 'fontweight=ultraextra boldlight', fontweight='extra bold')
ax.text(0, 0, 'fontweight=black', fontweight='black')
plt.show()
fontweightプロパティで文字の太さを指定します。
0-1000の数値か、太さを表す{‘ultralight’, ‘light’, ‘normal’, ‘regular’, ‘book’, ‘medium’, ‘roman’, ‘semibold’, ‘demibold’, ‘demi’, ‘bold’, ‘heavy’, ‘extra bold’, ‘black’}のいずれかで指定します。


コメント