目次
複数のグラフの配置の仕方①
FigureオブジェクトにAxesオブジェクトを加えていく
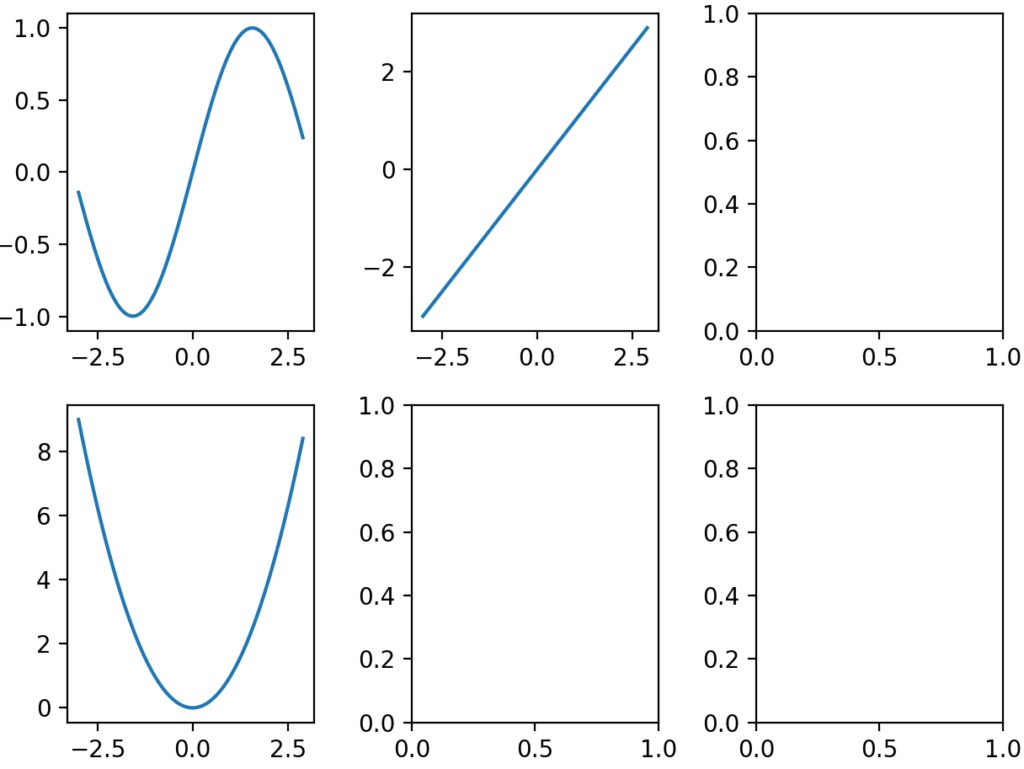
まずFigureインスタンスを作成し、add_subplotメソッドを用いてそのFigureインスタンスにAxesインスタンスを必要な数だけ追加していきます。例えば、1行 x 2列で2つのグラフを配置する場合は次のようになります。
import numpy as np
import matplotlib.pyplot as plt

x = np.arange(-3, 3, 0.1)
y1 = np.sin(x)
y2 = x

fig = plt.figure()
ax1 = fig.add_subplot(121)
ax2 = fig.add_subplot(122)

ax1.plot(x, y1)
ax2.plot(x, y2)
plt.show()
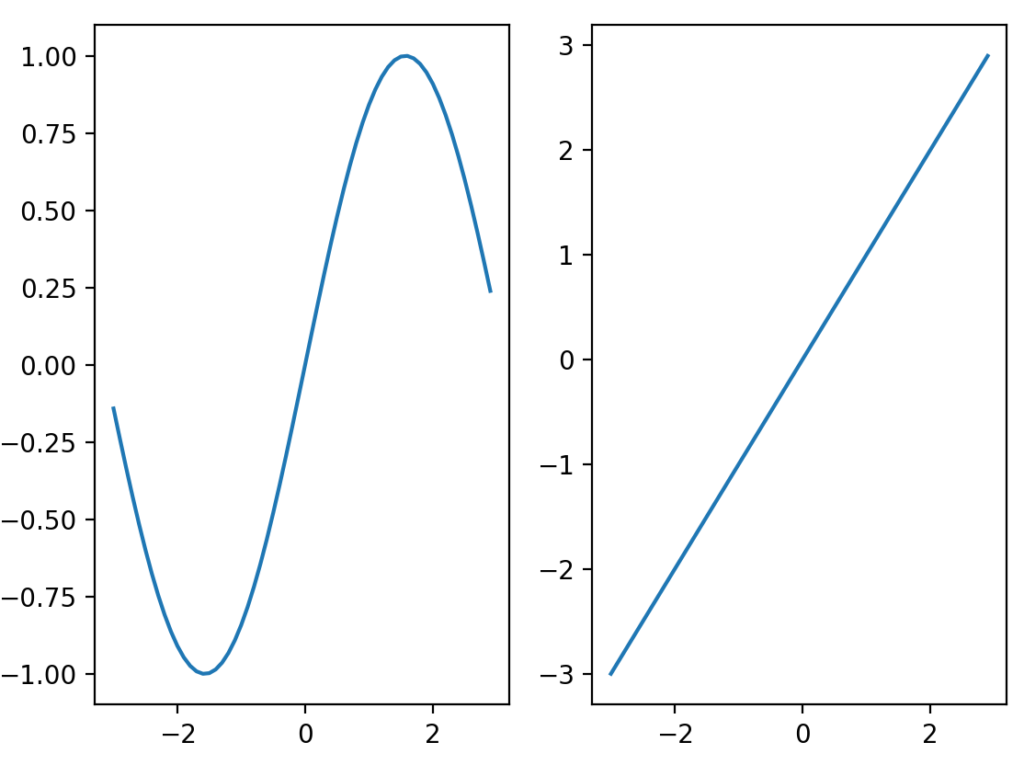
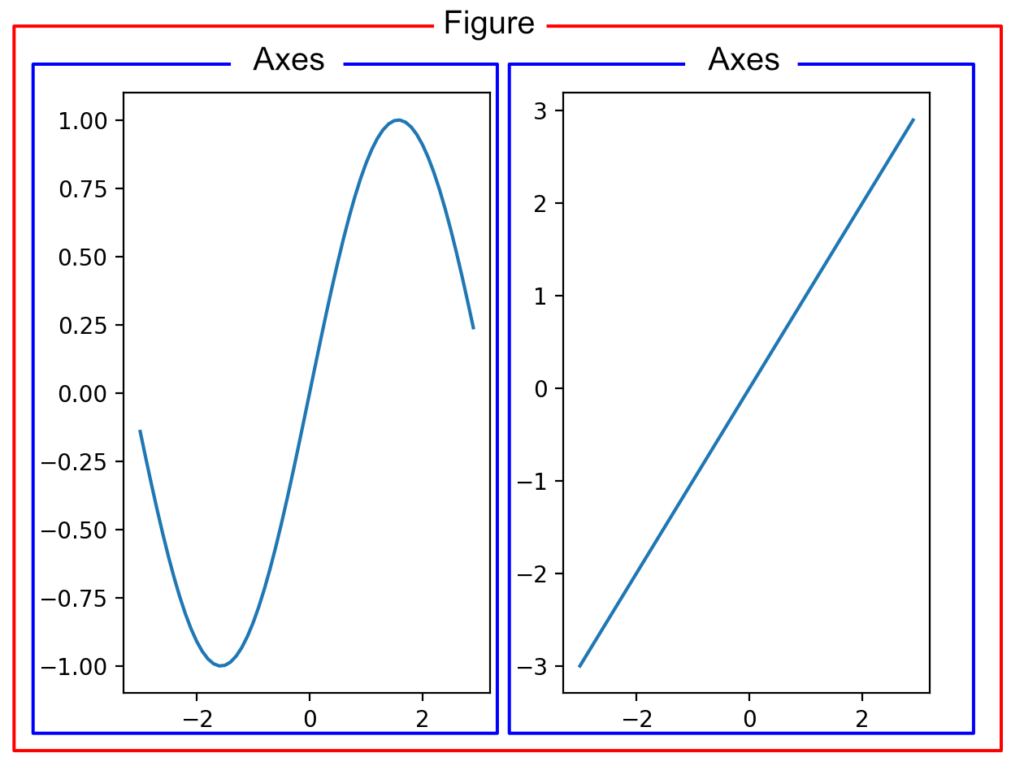
FigureとAxesの関係は「matplotlibにおけるグラフの構造」を参照してください。Figureオブジェクトの中に複数のAxesオブジェクトを持つことができるので、今回の例では下図のようにFigureオブジェクトの中に2つのAxesオブジェクトを持っている状態になります。
add_subplotメソッドの引数の設定の仕方は次の2通りあります。
- add_subplot(nrows, ncols, index)
- nrows : 作成する行数, ncols : 作成する列数, index : 何番目の位置に作成するか
- add_subplot(pos)
- pos : nrows, ncols, indexを連続した数として表したもの
例えば、2行 x 3列でグラフを作成し、左上から右下に向かってカウントしたときに4番目の位置にグラフを作成する場合は、
- add_subplot(2, 3, 4)
- add_subplot(234)
となります。
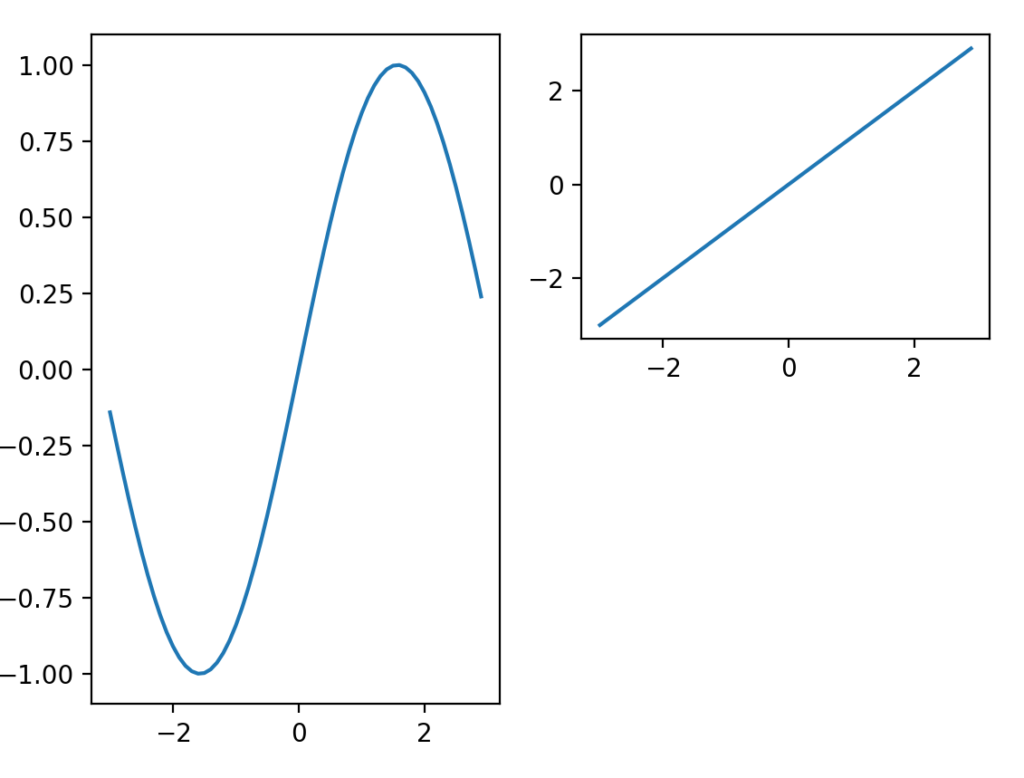
サイズの違うグラフを配置する
add_subplotメソッドで行数・列数の分割の異なるグラフを引数に指定すると、次のようにサイズの違うグラフが作成できます。
import numpy as np
import matplotlib.pyplot as plt

x = np.arange(-3, 3, 0.1)
y1 = np.sin(x)
y2 = x

fig = plt.figure()
ax1 = fig.add_subplot(121)
ax2 = fig.add_subplot(222)

ax1.plot(x, y1)
ax2.plot(x, y2)
plt.show()
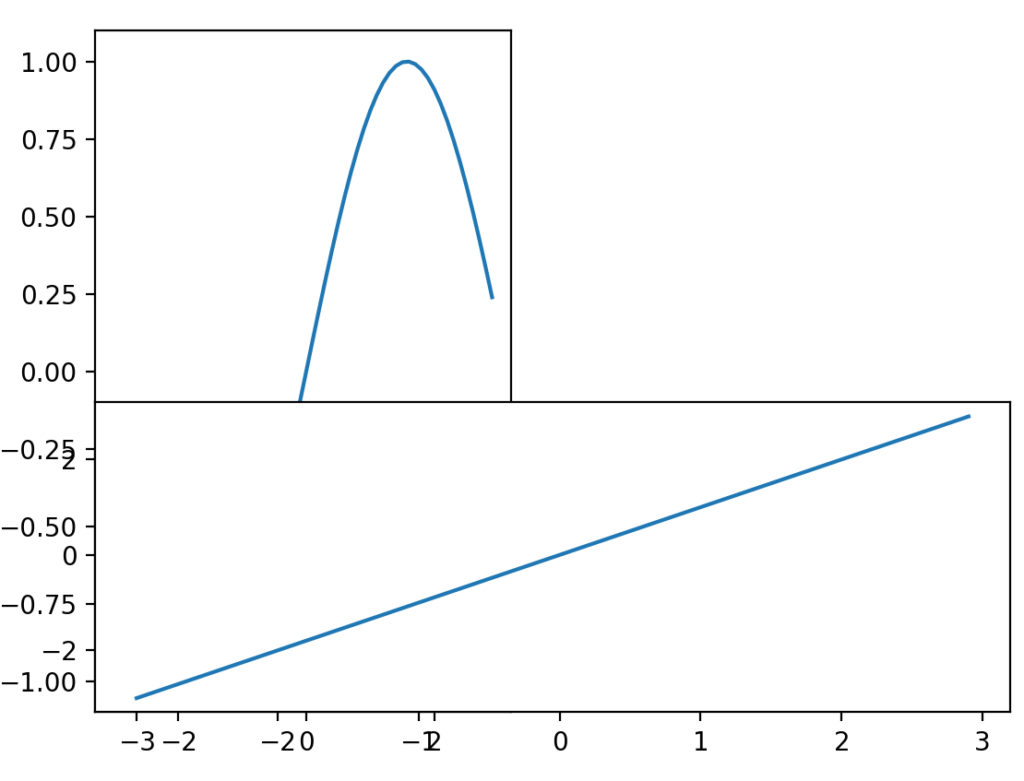
この時、グラフが重なってしまうと、後から追加したグラフが上に表示されます。
import numpy as np
import matplotlib.pyplot as plt

x = np.arange(-3, 3, 0.1)
y1 = np.sin(x)
y2 = x

fig = plt.figure()
ax1 = fig.add_subplot(121)
ax2 = fig.add_subplot(212)

ax1.plot(x, y1)
ax2.plot(x, y2)
plt.show()
複数のグラフの配置の仕方②
FigureオブジェクトとAxesオブジェクトを同時に作成する
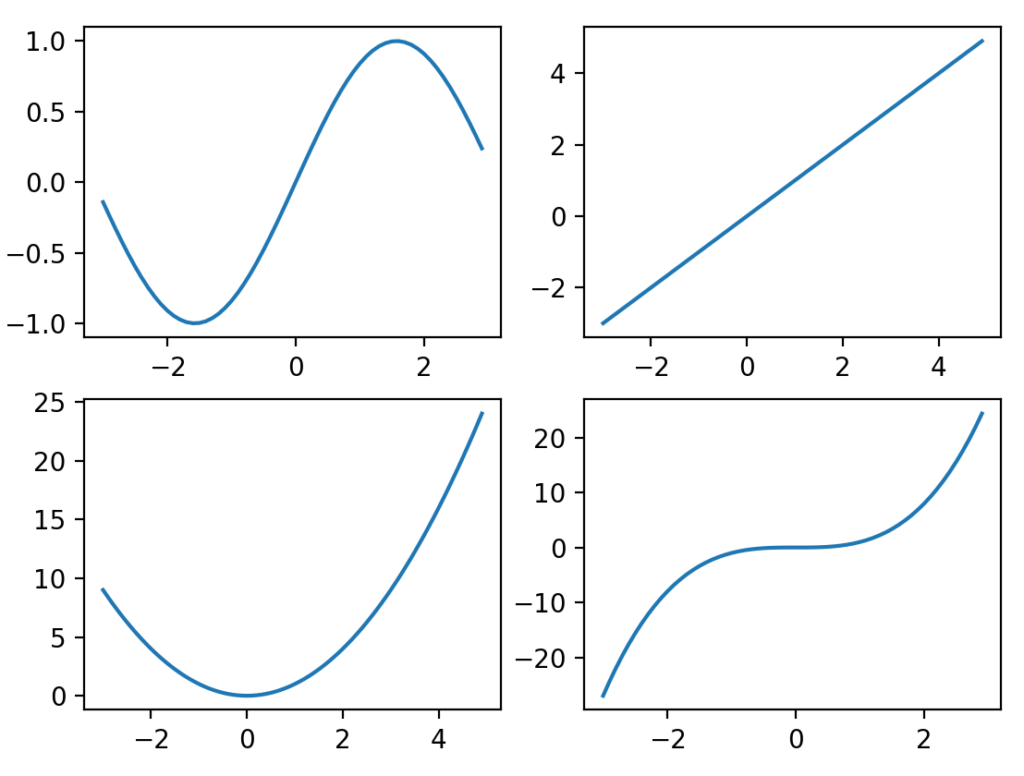
pyplot.subplots関数を用いると、FigureオブジェクトとAxesオブジェクトが同時に作成できます。Axesオブジェクトが複数ある場合は、Axesオブジェクトのリストが二次元リストとして取得できます。
import numpy as np
import matplotlib.pyplot as plt

x = np.arange(-3, 3, 0.1)
y1 = np.sin(x)
y2 = x
y3 = x ** 2

fig, ax = plt.subplots(2,3)

ax[0,0].plot(x, y1)
ax[0,1].plot(x, y2)
ax[1,0].plot(x, y3)
plt.tight_layout()  # グラフの重なりを避ける
plt.show()
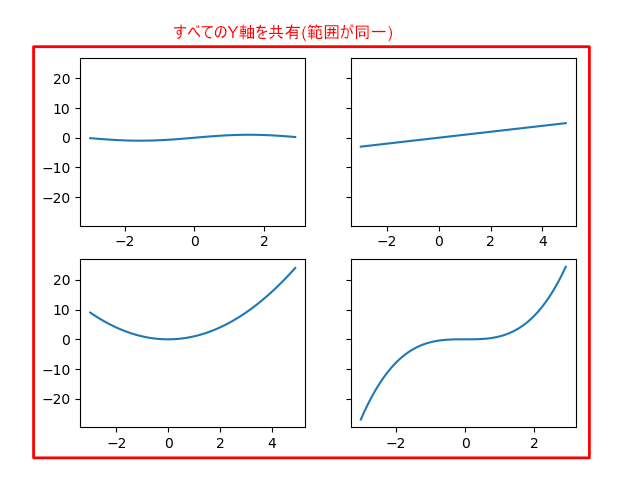
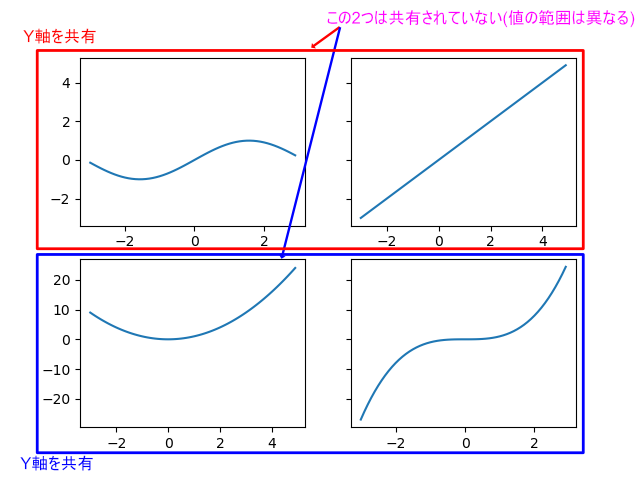
グラフの軸を共有する
pyplot.subplots関数のsharex引数、sharey引数で共有する軸を設定します。
import numpy as np
import matplotlib.pyplot as plt

x1 = np.arange(-3, 3, 0.1)
x2 = np.arange(-3, 5, 0.1)
y1 = np.sin(x1)
y2 = x2
y3 = x2 ** 2
y4 = x1 ** 3

fig, ax = plt.subplots(2,2)

ax[0,0].plot(x1, y1)
ax[0,1].plot(x2, y2)
ax[1,0].plot(x2, y3)
ax[1,1].plot(x1, y4)
plt.show()
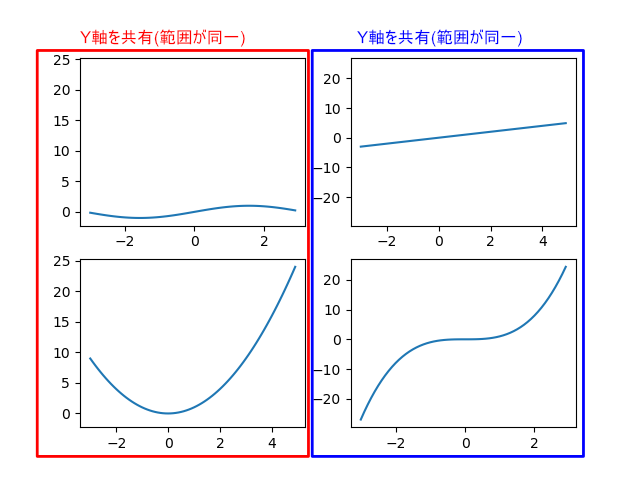
上のプログラムのpyplot.subplots関数だけ抜き出して、sharex引数、sharey引数の効果を確認します。
sharex=False, sharey=True
fig, ax = plt.subplots(2, 2, sharex=False, sharey=True)
sharex=False, sharey=’row’
fig, ax = plt.subplots(2, 2, sharex=False, sharey='row')
sharex=False, sharey=’col’
fig, ax = plt.subplots(2, 2, sharex=False, sharey='col')


コメント